
Test case history and pass rate across CI runs
The test case page shows one test from a single run, along with its history across the project's 30 most recent runs that included it. Open it to read a failure message and stack trace in full, or to check whether a failure was a one-off or the test is flaky. For a skipped test, the page also shows how long it has been skipped.
To get there, open a test run, click a test suite in the test suites table, and then click the test case's name in the list of test cases. Test names in the What Changed panel and in the groups under failure patterns also link straight to the test case page.
Test status and run time
The top of the page shows the test case name with its class name underneath. Next to the test's status in this run (Passed, Failed, Errored, Skipped, or Passed on retry) you'll see its run time and how long ago the run happened, and hovering over that time shows the exact date.
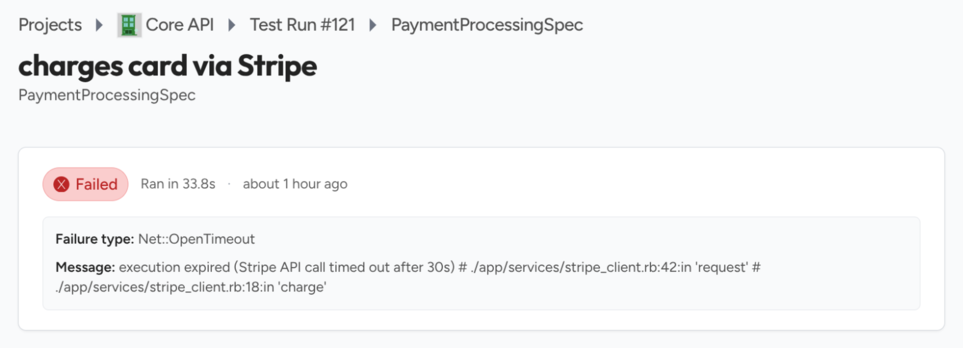
Failure and skip details from your JUnit XML
Below the status, a box shows the details your JUnit XML report recorded for this result. What it contains depends on the status:
- Failed: the failure type, the failure message, and the full failure details, such as a stack trace.
- Errored: the error type, message, and details.
- Passed on retry: how many retries the test needed, plus the type, message, and details from the attempt that failed.
- Skipped: the reason your test runner gave for skipping the test, when it wrote one, and how long the test has been skipped.
TestNod shows these fields exactly as your test framework wrote them, so only the ones in your report appear, and a passing test has no details box. See retries and reruns for how TestNod spots a test that passed on retry.
How long a test has been skipped
For a skipped test, the "Skipped since" line links to the run where its current streak of skips began and gives the date of that run. When the streak started before the run you're viewing, the line also says how many days earlier that was. For example, "Skipped since: Run #412 on September 3, 2026 (61 days before this run)". If this run is the first one where the test was skipped, the line points at this run.
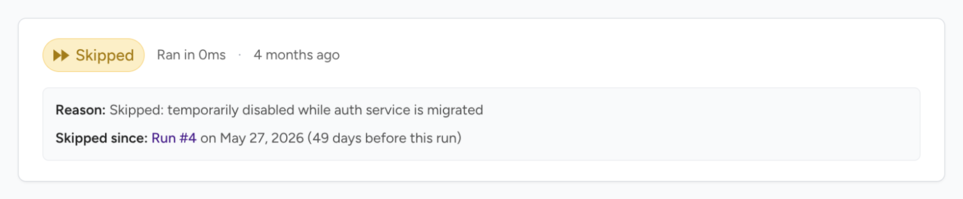
The streak only counts runs with the same tags as the run you're viewing, because a test can be skipped in one kind of build and still run in another. For example, a test skipped in runs tagged nightly keeps its streak even if it runs in untagged pull request builds. The streak starts right after the most recent matching run where the test ran, whatever its result was. TestNod looks back at most one year, so a test that has been skipped for longer than that shows a start date about a year before the run.
The stale skipped tests alert uses the same streak to decide when a test has been skipped for too long. You see the "Skipped since" line whether or not that alert is turned on.
Pass rate and duration across recent CI runs
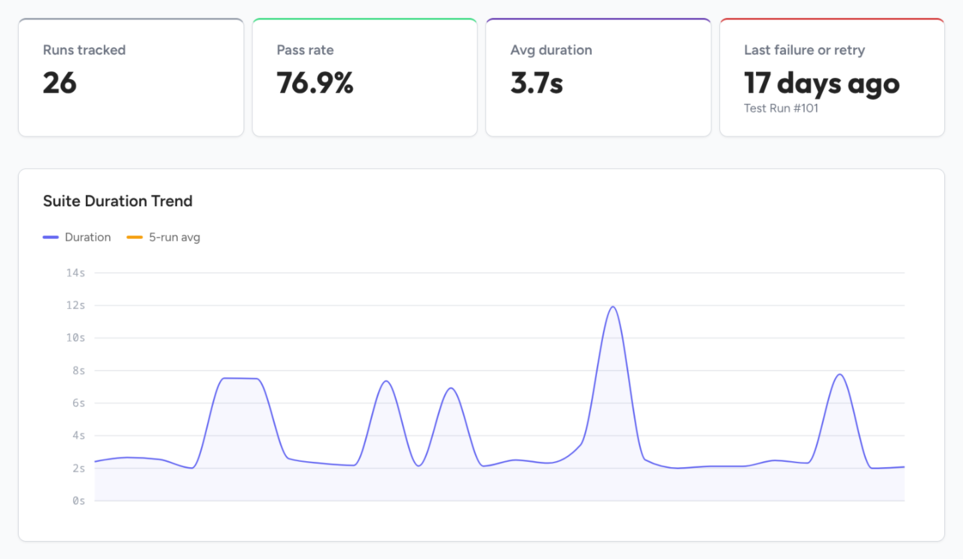
Four cards summarize the 30 most recent runs in the project that included this test. That history covers every branch and tag, and it isn't limited to runs before the one you're viewing, so newer runs are part of it when there are any.
- Runs tracked. How many runs are in the history, up to 30.
- Pass rate. The share of those runs where the test passed. A pass on retry counts as a pass, and the card says how many runs needed a retry. Skipped runs count against the pass rate.
- Avg duration. The test's average run time across the history.
- Last failure or retry. How long ago the test last finished with any result other than Passed, with that run's number underneath. Skipped runs count here too, and "Never" means the test passed in every run in the history.
Below the cards, a chart plots the test's run time in each of those runs from oldest to newest, alongside a five-run average, which makes a test that's gradually getting slower easier to spot. With fewer than five runs in the history, the chart shows a "Not enough data" message instead.
Recent runs
The bottom of the page lists the same runs, newest first, with the run number, date, the test's status in that run, and how long it took. Click a run number to open that test run. Reading down the Status column shows whether a failure is new or whether the test is flaky and has been failing on and off for a while, and the test flakiness alert makes that same check automatically on every run.