Automated Test Analytics
Made Easy.
Your CI shows you one build at a time. TestNod connects the dots across hundreds, helping you spot flaky tests, catch regressions, and see how performance changes over time.
Your CI tells you what failed, but not why it keeps happening
Flaky tests waste hours
We've all done it. A test fails, you hit re-run, it goes green, and you forget about it. Then the same test fails again next week. Without tracking, these flaky tests quietly eat hours across the team.
Regressions hide in plain sight
Your test suite gets a little slower each week. Pass rates drift down gradually, from almost 100% to under 90% over a couple of months. By the time someone flags it, you're dealing with a real problem.
CI logs aren't analytics
CI gives you one answer: did this build pass or fail? It won't tell you which tests are getting flakier, what's slowing down, or where to focus your effort. That kind of insight means digging through logs yourself.
TestNod shows you the trends that CI alone doesn't
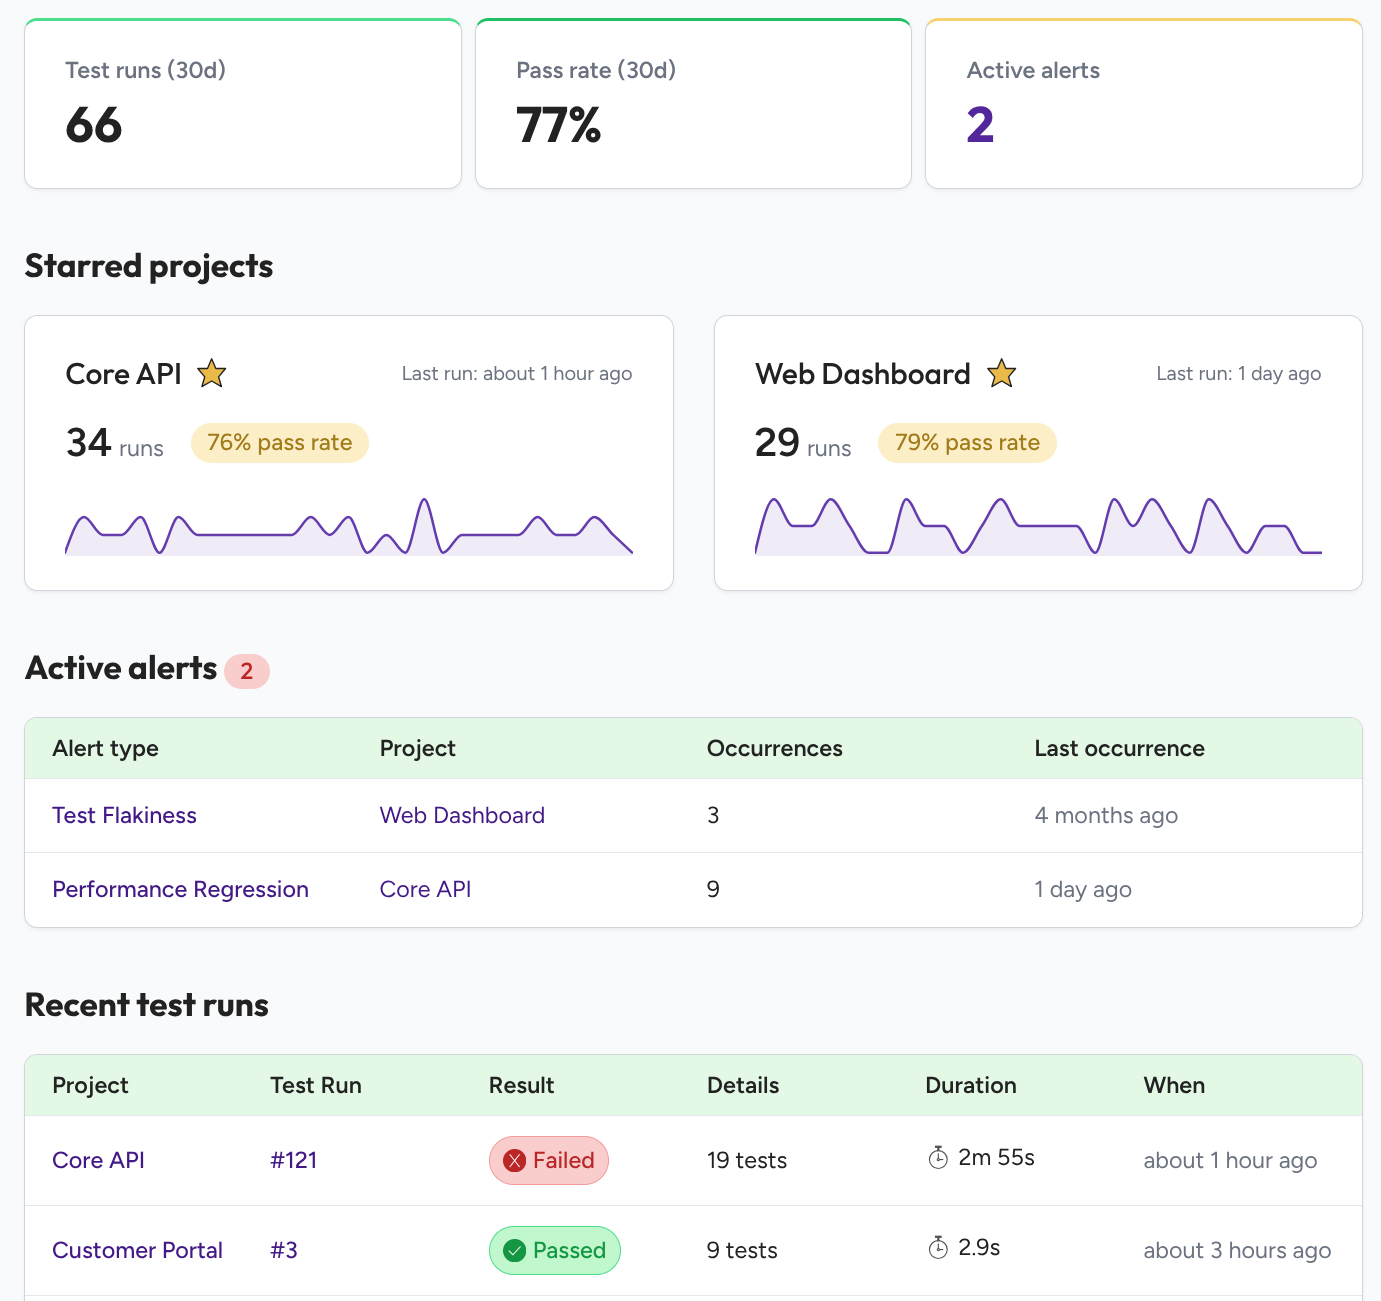
CI tools tell you if a build passed or failed. That's one data point. TestNod connects data points across builds and shows you what you'd otherwise miss: which tests fail intermittently, where durations are creeping up, what changed and when.
Payments API
Last run: 2 hours agoMobile App
Last run: 5 hours agoThe signal your CI doesn't give you
Send your test results once and TestNod takes it from there, turning every build into trends, flaky test patterns, alerts, and run comparisons you can act on.
Dead-simple integration
Add one step to your CI pipeline and you're done. TestNod works with GitHub Actions, CircleCI, GitLab, Jenkins, Buildkite, and anything else you run your tests on, with nothing to build and nothing to maintain. Split your suite across parallel jobs and the results still come back as one run.
Trends over time
See how pass rates, failures, and test durations move across builds, and pinpoint exactly when something changed. One view covers every project you have, and since each one is measured against its own history, the project that runs 200 times a day never drowns out the one that runs twice a week.
Smart alerts
TestNod tells you when a test turns flaky and starts failing intermittently, when runs get slower than usual, when a batch of tests goes red at once, and when skipped tests start piling up. You decide which of those matter for each project and where to draw the line, and a noisy alert can be snoozed without switching it off for good.
What changed since the last test run
Every run is compared against the last one like it, so you see what broke, what got fixed, what slowed down, and what came and went. Failures that share a cause are grouped together, which turns twelve red tests into three real problems. Every test also keeps its own history, so you can see how often it passes and how long it takes.
A run summary you can read in ten seconds
Nod reads every finished run and writes up what happened in plain language, from the kind of failures that showed up to which ones look like the same underlying problem. You get the gist before you open a single test, and the same recap sits at the top of your Monday morning email.
Plugs into Slack and your own tools
Alerts land in Slack, where your team already talks about them anyway. If you keep dashboards of your own, TestNod can feed results straight into them, so everything ends up where you already look.
Your team is shipping faster than ever. Your test suite needs to keep up.
AI coding assistants are changing the pace of development. More code, faster PRs, more frequent deploys. That works fine until a flaky test blocks the pipeline or a regression slips through because nobody had time to investigate. The faster you ship, the more your tests need to actually tell you something.
Up and running in minutes
There's no complex setup or agents to install. Just pipe your test results to TestNod and it handles the rest.
Create a project (30 seconds)
Create a project in TestNod and grab your API key to start uploading test results from CI.
Add to your CI pipeline (2 minutes)
Copy one of the snippets below into your CI config. Whatever you run your tests on, there's a version that fits.
See patterns emerge
Your first run shows up in the dashboard right away, and the second one already tells you what changed between them. Trends fill in over the next few runs, and alerts switch on once there's enough history behind them to be worth trusting.
- name: Upload test results to TestNod
  if: ${{ !cancelled() }}
  uses: testnod/testnod-uploader-action@v1
  with:
    file: tmp/rspec.xml
token: ${{ secrets.TESTNOD_PROJECT_TOKEN }}orbs:
testnod-uploader: testnod/[email protected]
jobs:
test:
steps:
- testnod-uploader/upload:
file: tmp/rspec.xml
workflows:
test-and-upload:
jobs:
- test:
context: testnodinclude:
- component: gitlab.com/testnod/testnod-uploader/[email protected]
inputs:
file: tmp/rspec.xml
tags: ci,rspec# 1. Start the upload.
response=$(curl -sS -X POST https://testnod.com/integrations/test_runs/upload \
-H "Project-Token: $TESTNOD_PROJECT_TOKEN" \
-F "test_run[metadata][build_id]=$BUILD_ID")
# 2. Send your test report.
upload_url=$(echo "$response" | jq -r .presigned_url)
curl -sS --upload-file tmp/rspec.xml "$upload_url"
# 3. Finish the run.
curl -sS -X POST https://testnod.com/integrations/test_runs/finalize \
-H "Project-Token: $TESTNOD_PROJECT_TOKEN" \
-d "build_id=$BUILD_ID"Frequently asked questions
TestNod works with any test framework that produces JUnit XML reports, including RSpec, pytest, JUnit, Cypress, Playwright, and many others. We have ready-made integrations for GitHub Actions, CircleCI, and GitLab, and every other CI service works with a short script you can copy from the docs, including Jenkins, Buildkite, Travis CI, and anything self-hosted.
Yes. All data is encrypted in transit and at rest. We store what your test reports contain, like test names, durations, pass or fail status, and failure messages, plus the branch and commit they came from. We never see your source code or build artifacts.
TestNod is free while we're in beta. A free tier with a limit on test runs is planned, and we're still working out the details on paid plans. If you join early access, you'll get the best pricing when we launch.
Most teams are up and running in under five minutes. You add a short step to your CI config that uploads the report your test framework already generates, so there's nothing to change about your tests themselves. We have ready-made snippets for GitHub Actions, CircleCI, and GitLab, plus a short script that covers Jenkins, Buildkite, and everything else.
TestNod watches for the patterns that are hard to catch by hand, like a flaky test that passes one run and fails the next, runs that get slower than usual, a batch of tests going red at once, or skipped tests piling up. You choose which ones matter for each project and where to draw the line, and every check compares the current run against your own recent runs rather than some global average. When something crosses that line you get the specific tests involved and the data behind it, not just a vague warning, and it reaches you by email or Slack at most once a day.
Yes. Every organization in TestNod supports multiple members, and you can connect as many projects as you need under a single org. People join by email invite and sign in with a password, Google, or GitHub. Admins look after project settings and alerts, while everyone else can see the full picture and snooze an alert that's making noise. The whole team sees the same trends and alert history, which makes it easier to decide together which failures are worth investigating and which are just noise.
No. TestNod reads JUnit XML, which is a standard reporting format that virtually every test framework can produce, often with a single flag or a small config change in your test runner. Your tests, assertions, and CI pipeline stay exactly the same.
Yes. Each parallel job sends its own results and TestNod combines them back into a single run, so a suite split across ten containers still reads as one. That covers matrix builds, parallel_tests, pytest-xdist, and sharded Cypress or Playwright suites.
Yes. TestNod can push your results to your own tools through webhooks as runs finish and alerts fire, and there's an API if you'd rather pull them on your own schedule. Nothing you send us is locked in.
Be first to try TestNod
We're opening early access soon. Drop your email and we'll get you in, and we're happy to help you set up too.