
Automated flaky test detection in CI test runs
TestNod's flaky test detection tracks how often each test fails across your recent CI runs and fires an alert when a test has been failing at or above a configurable rate. The check runs automatically against every new test run that finishes with at least one failure.
What triggers the flakiness alert
When a test run finishes processing with at least one failed test case, TestNod takes the 20 most recent processed runs in the project that share the same set of tags as the new run. For each failed case in the new run, it counts how many of those 20 runs included that test and how many of them recorded the test as a failure.
The alert fires when:
failure_count / total_count >= threshold / 100
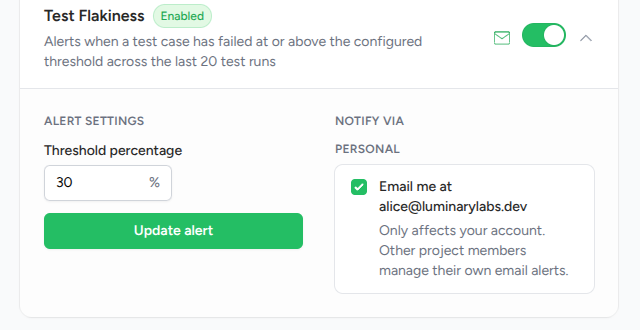
The default threshold is 30%.
Example: if a test was present in all 20 of the most recent same-tag runs and failed in 6 of them, the alert trips the next time the same test fails.
The 20-run baseline
Flaky test detection needs at least 20 processed runs on the same set of tags before it can fire on a project. With fewer than that on the matching tag set, TestNod skips the check and no event is recorded. As newer runs come in and older ones drop off, the window rolls forward and the rate adjusts to recent behavior.
Example: detecting a flaky test
Your project tags every CI run with ci and unit and uses the default 30% threshold. A new run finishes, and the test OrderProcessingTest::handles_bulk_orders fails. TestNod looks at the last 20 runs that share the ci, unit tag set, sees that the same test has been included in all of them and failed in 7 (35%), and fires the alert because that rate is above the 30% threshold. The event records 35%, the 7-of-20 counts, the failure message from the new run, and the tag set used for the comparison.
What the alert event shows
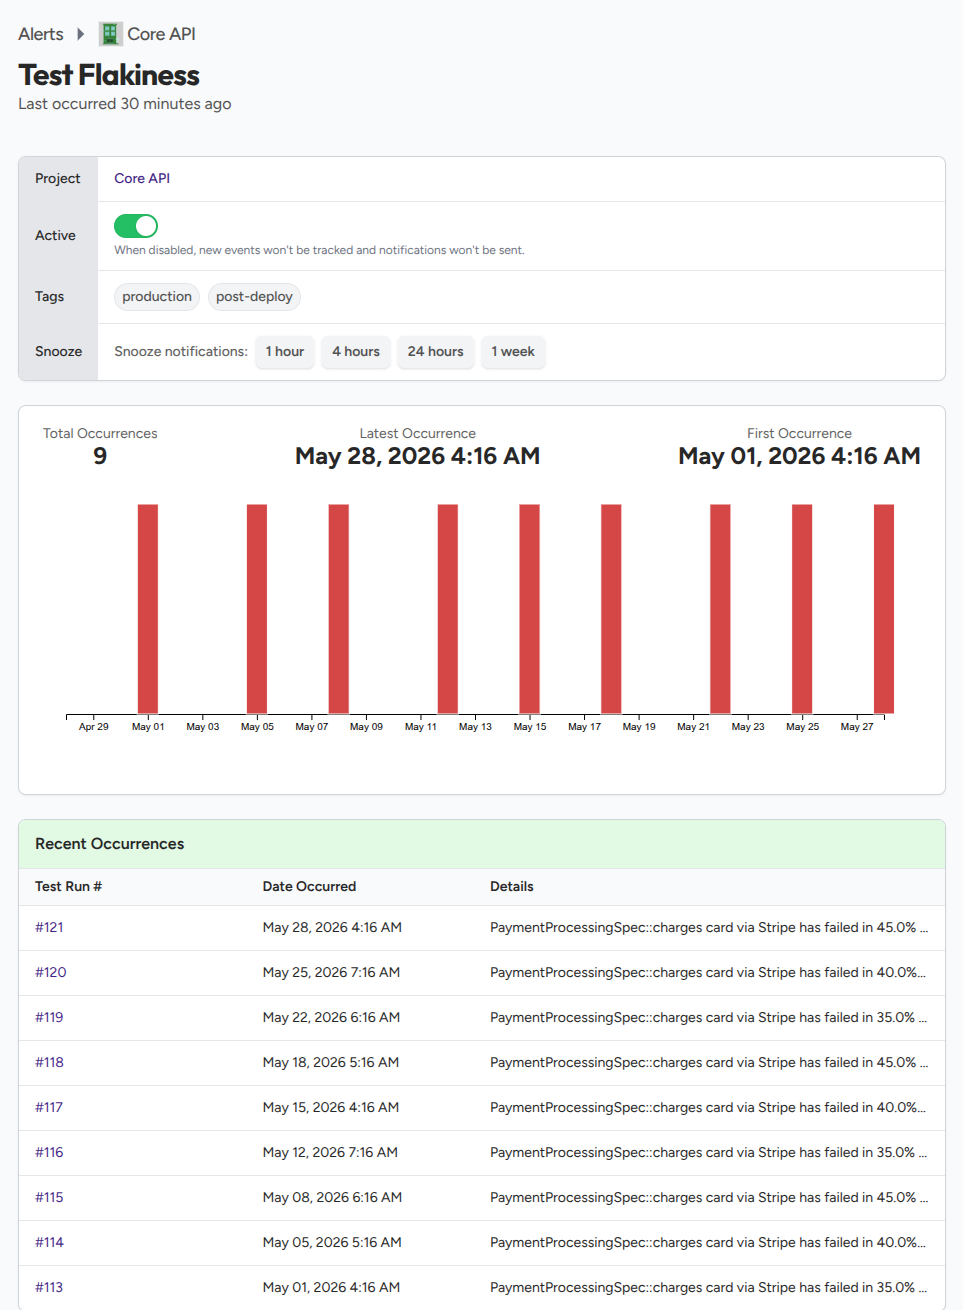
When the alert fires, the event recorded against it shows the test that tripped it, the failure rate across the window, the raw counts behind that rate, the most recent failure message, and the tag set used for the comparison. The alert detail page links back to the triggering run so you can open it and see the failure in context.
Reading the failure rate
The rate on its own does not tell the full story. A 30% rate from 6 failures across 20 runs is a different signal from a 30% rate from 3 failures across 10 runs. TestNod shows both numbers on the event so you can judge which it is. A high rate over a small count usually means the test is newer or only runs in some configurations. A high rate over a large count means the test is a chronic flake.
Tuning the flakiness threshold
Two common reasons to adjust the default 30%:
- Too many borderline misses. Lower the threshold to 10–20% if you want every test that occasionally fails to surface. Expect a longer initial list as the check finds flakes that were already there.
- Only chronic flakes matter. Raise the threshold to 50% if you only want to hear about the worst offenders and are content to treat anything below as background noise.
Project admins set the threshold from the alert configuration page. See Configuring alerts for the walkthrough.
What the alert does not catch
- A test that always fails. That is not flakiness; it's a broken test. The What Changed panel surfaces it on the first run it fails.
- Cross-tag flakes. Tag matching is exact. A test that flakes in
smokeruns but holds steady inintegrationruns trips only on smoke runs. - First-time failures. A test that has not appeared in the prior 20 runs has no history to measure against, so it can't trip the alert on its first observed failure.
- Errored tests. TestNod treats errors as environment or infrastructure issues rather than flakiness, so a case that errors out instead of failing cleanly does not count toward the failure rate.
Enabling flaky test detection
Once your project has 20 same-tag runs of history, an admin can enable the flakiness alert on the alert configuration page and set the threshold. Each subsequent run with at least one failed test case is then evaluated against the configured rate. When a test crosses the threshold, an event is recorded on the alert detail page and a notification email is sent to project members who have not opted out.