
What Changed: CI test run diff against a baseline
The What Changed panel near the top of each test run page compares the current run against a baseline CI build, surfacing new failures, slowdowns, and other changes between the two runs. It is the fastest way to read a CI build: if a category is empty, nothing happened there, and if a category has entries, those are the tests worth looking at first.
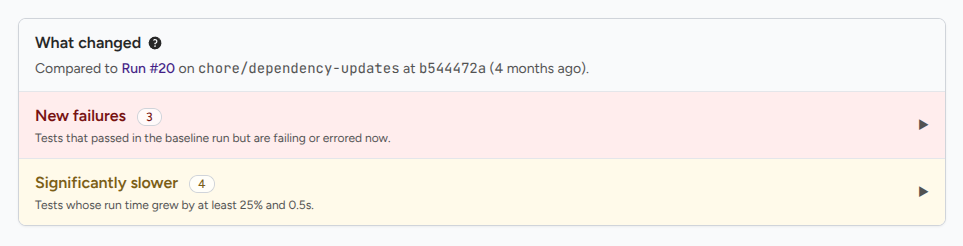
How TestNod picks the baseline
TestNod picks the baseline automatically by walking through a list of options and stopping at the first match:
- A prior processed run on the same branch with the same tag set as the current run.
- A prior processed run on the same branch, regardless of tags.
- Any prior processed run in the project.
If no baseline is found, typically because this is the first run in your project, the panel says so and skips the diff. The next run you upload will have something to compare against.
The baseline run number and its branch and commit SHA show up in the panel header, so you can confirm which run TestNod is comparing against and jump to that run with one click.
What each category shows
New failures
Tests that are failing or errored in the current run and were not failing in the baseline. When a CI build is red, this is usually the first place to look, since it points you straight at the changes that broke something since the last build.
Tests that did not exist in the baseline at all show up in the Added section instead of here, even if they are failing.
Newly fixed
Tests that were failing in the baseline and pass in the current run. Useful as a positive signal that the change set fixed something, and for confirming that an intentional fix landed in the run you expected.
Significantly slower
Tests whose run time grew by at least 25 percent and at least 0.5 seconds between the baseline and the current run. Both thresholds must be met before a test shows up here, which keeps noise out of the section:
- A 50 ms test that ran 200 percent slower (now 150 ms) is not flagged. The relative change is large but the absolute change is tiny.
- A 10 second test that ran 5 percent slower (now 10.5 s) is not flagged either. The absolute change is meaningful but the relative change is small.
A 4 second test that grew to 5 seconds (25 percent and 1 second) is flagged.
The list is sorted by largest slowdown first, so the test with the biggest percentage jump sits at the top of the section. For longer-term performance trends across many runs rather than a single jump between two, the performance regression alert tracks the same metric over time.
Added
Tests present in the current run that were not in the baseline. Usually these are genuinely new tests, but tests that were renamed or moved can also land here, because TestNod identifies a test by its class name and test name together.
Removed
Tests present in the baseline that are not in the current run. Usually these are deleted tests, but a runner failure that prevented a test from being collected at all can also send a test to this section.
How TestNod matches tests across runs
Two tests are treated as "the same" when both the class name and the test name match exactly across runs. If your test framework changes either value between runs, for example by appending a timestamp or a run ID to a test name, the panel will show the same logical test as both removed and added. Stabilize the names in your runner output so the diff stays accurate over time.
What's next
For an end-to-end walkthrough of the rest of the test run page, see the Test run page tour. If you want to dig into grouped failures within a single run, the Failure patterns page explains how TestNod clusters tests that fail with the same root cause.