
Test run page tour: reading CI JUnit XML reports
The test run page is where you'll spend most of your time in TestNod. Every JUnit XML report you upload from CI lands here, and the page is laid out so you can read a build top to bottom: the result and metadata at the top, what changed since the previous run next, then the failure patterns and per-suite stats. This page walks through each section so you know where to look and what each piece is telling you.
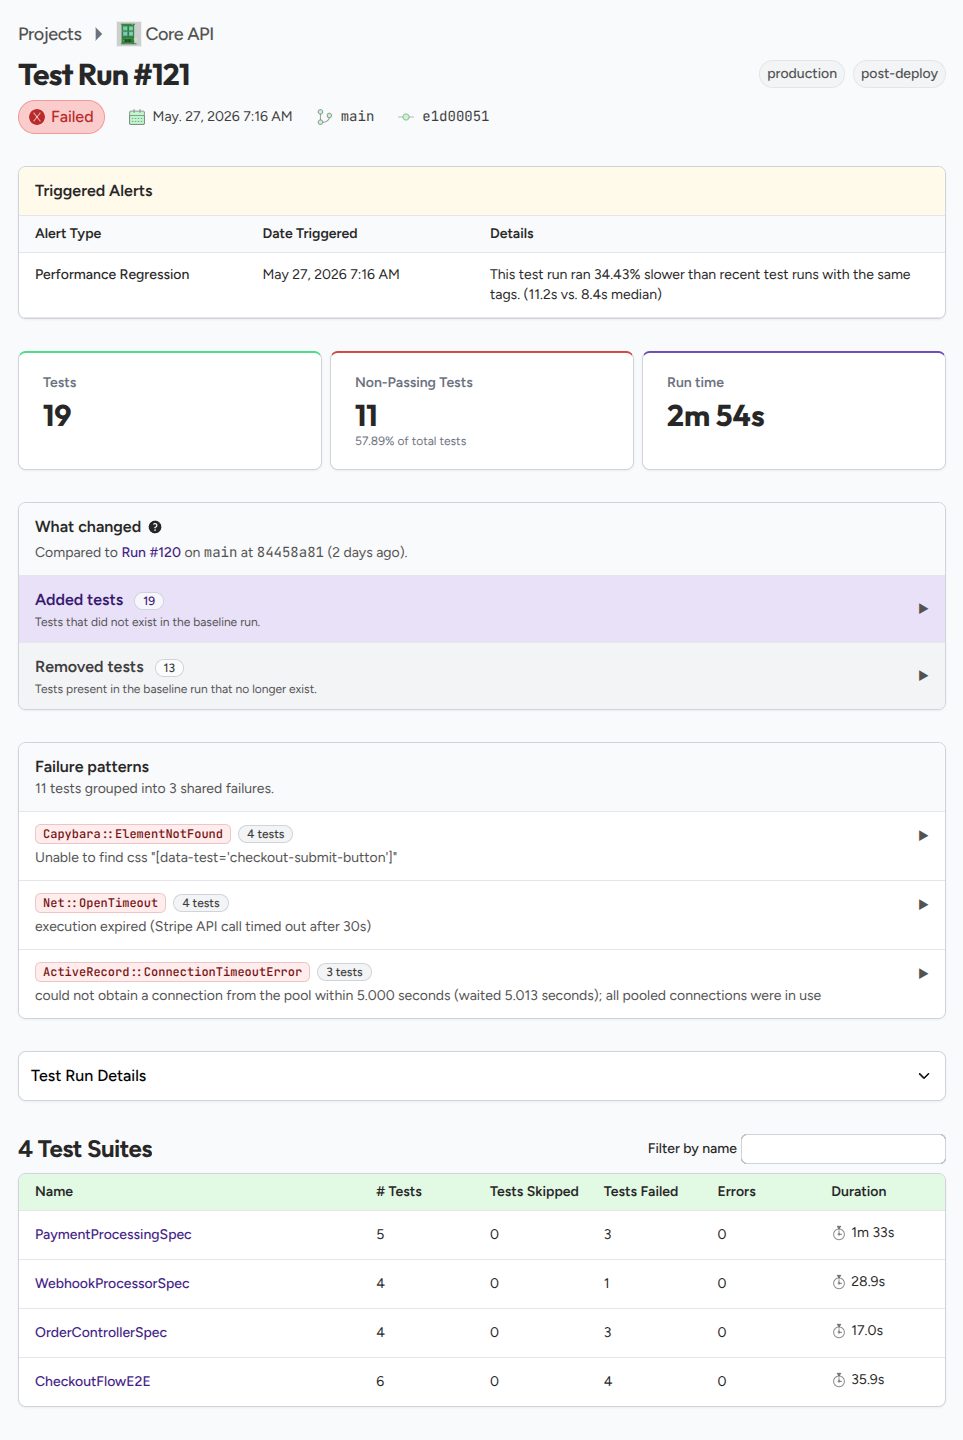
The page header
The strip at the top of the page is where the run's metadata lives.

- Result. A "Passed", "Failed", or "Errored" status driven by the final state of the run. A run is errored if any test case errored, failed if at least one case failed without errors, and passed otherwise.
- Build link. When the upload included a build ID, the header shows "Build #<build_id>". If you also sent a build URL, the build number links back to the original CI run so you can jump to the source logs in one click.
- Timestamp. When TestNod received the upload for processing.
- Branch. The branch the build ran on, when you sent it as part of the upload.
- Commit SHA. The Git commit the build ran against.
- Tags. All tags attached to the run, shown to the right of the page title.
Any metadata field your upload did not include is hidden, so the header only ever shows what's available. See Run metadata for how to populate each field from your CI.
The rest of the test run page populates once the run is finalized.
Triggered alerts
If any alerts fired against the run, a "Triggered Alerts" table appears below the header. Each row lists the alert type, the date it triggered, and a short detail line. Click a row to open the alert details in a side panel, or follow the link to the full alert page for snooze, resolve, and dismiss controls.
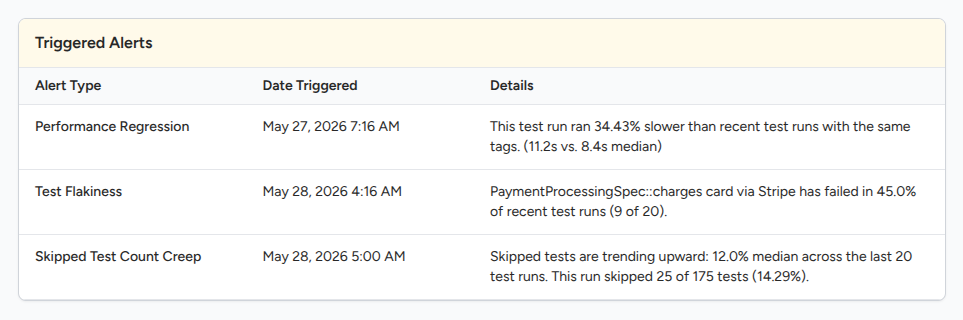
If no alerts fired against the run, the section does not render at all. The alert types TestNod runs against each new run are documented in Alerts overview.
Run summary cards
Three cards summarize the run at a glance:
- Tests: the total number of test cases across every suite in the run.
- Non-Passing Tests: failed, errored, and skipped cases combined, with the share of the total alongside.
- Run time: the sum of every case's recorded duration. This is the work the test framework reported, not the wall-clock time of the CI job.

What Changed
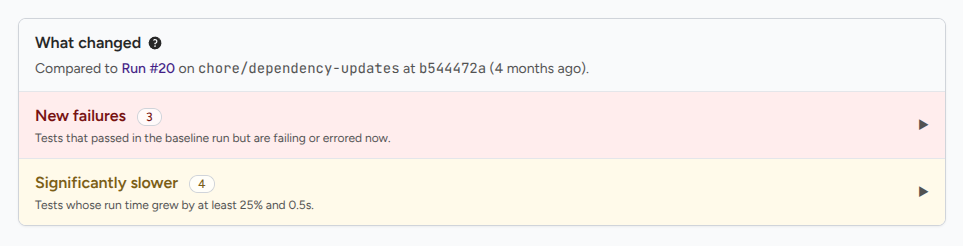
The "What Changed" panel sits below the summary cards and compares the current run against a baseline run. It surfaces five categories: new failures, newly fixed, significantly slower, added, and removed cases. The categories are the fastest way to read a build, because an empty category means nothing happened there and you can skip it. The full panel and the rules for picking the baseline are documented in What Changed.
Failure patterns
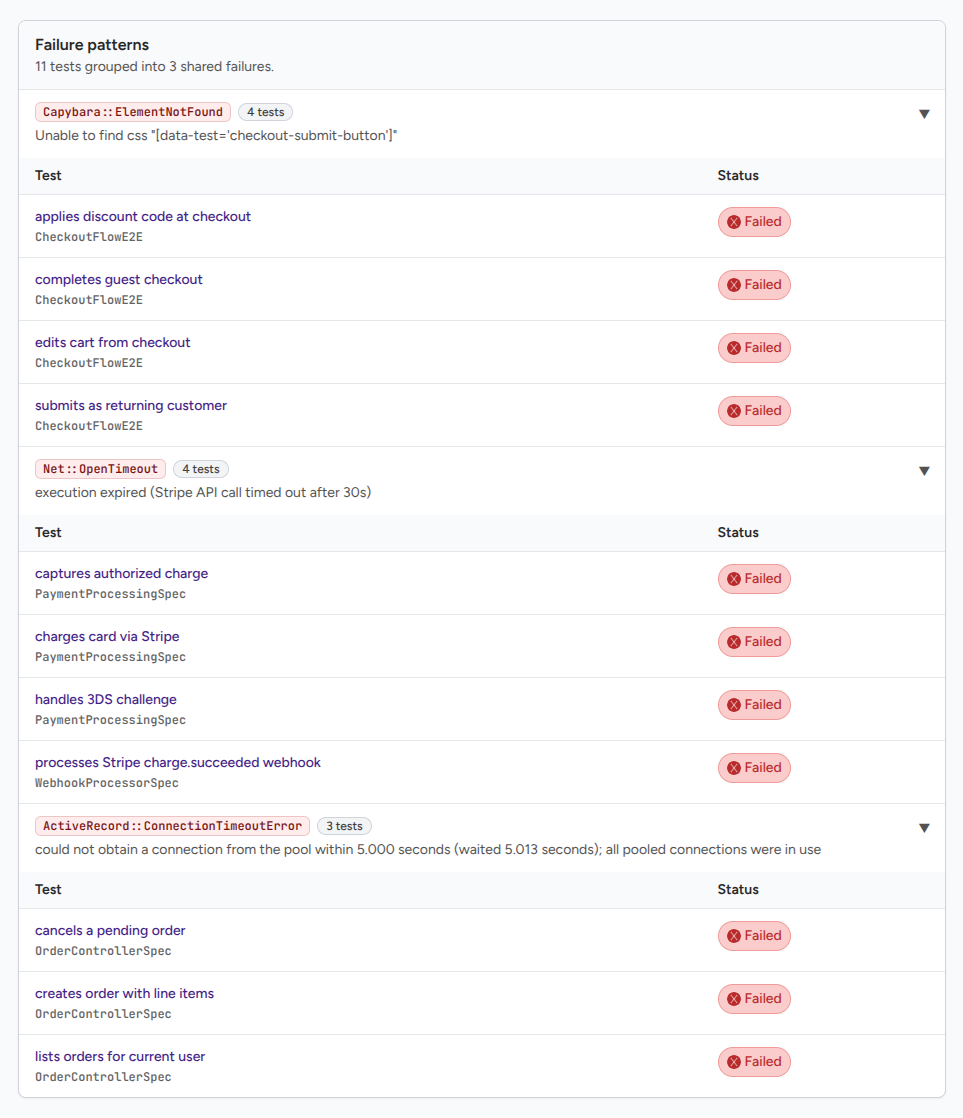
The failure patterns section renders below "What Changed" when at least two failed cases inside the run share the same failure signature. Each pattern is a group with a sample message and the list of cases inside it. If no signature has two or more failures, the section does not render at all. See Failure patterns for the rules and what the signature normalization does.
Test Run Details panel
Below failure patterns is a collapsible panel titled "Test Run Details". Click the header to expand it, then use the tabs to switch between captured standard output and captured standard error for the run as a whole. If your test framework writes anything to standard output or standard error at the run level, it shows up here verbatim.
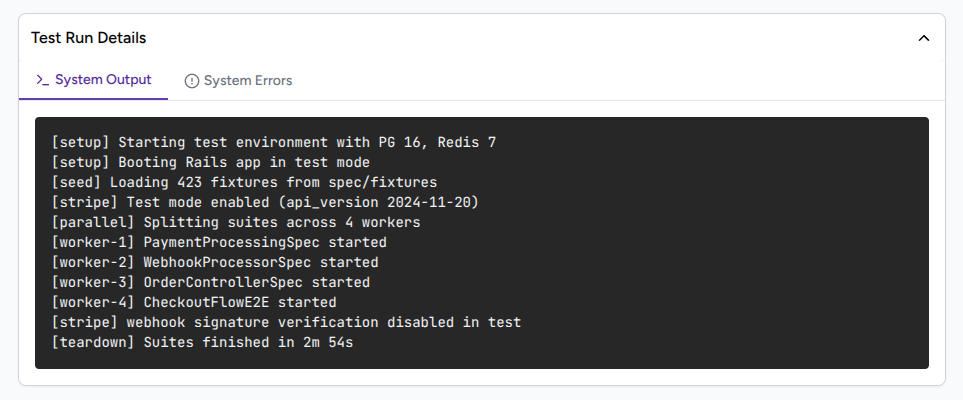
Per-case captured output is shown on the test case page, not here, since each case can have its own output and error blocks. The test details panel page covers what a single case shows.
Test suites
The bottom of the page lists every test suite in the run as a table. Each row shows the suite name, total tests, tests skipped, tests failed, errors, and duration. Click a suite name to open the suite detail page, where you'll find every test case inside the suite and the per-case filters.
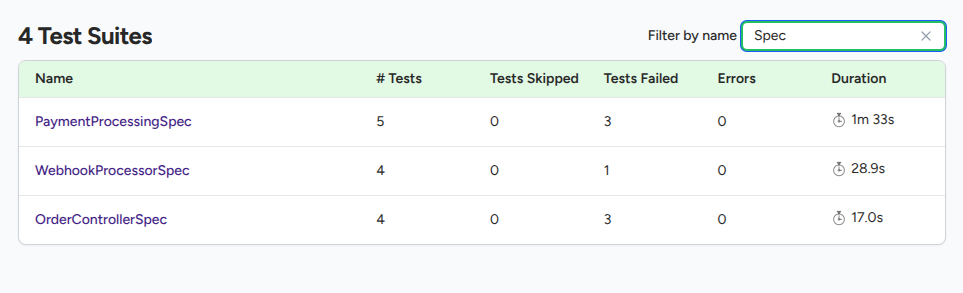
A "Filter by name" field sits above the table and scopes the visible rows by suite name. The filter only affects the suites table. To filter individual test cases by status (passed, failed, errored, skipped) or by case name, open a suite from the table. The per-suite page is where case-level filtering lives.
URL anatomy
/projects/<project_public_id>/test_runs/<run_public_id>
Both public IDs are stable for the life of the record, so you can bookmark or share a run URL without it going stale. Appending ?baseline=<other_run_public_id> overrides the baseline that "What Changed" picks automatically, so you can compare against a specific earlier run instead of the one TestNod picks for you. The override applies only to the "What Changed" panel. The rest of the page is unchanged.