Performance regression alerts for CI test runs
TestNod's performance regression alert tracks the total duration of your test runs and fires an alert when a new run exceeds the rolling median of recent same-tag runs by more than a configurable percentage. The check runs automatically against every new test run that finishes processing, catching gradual slowdowns that accumulate over weeks or months before they become normal.
What triggers the alert
When a test run finishes processing, TestNod takes the 20 most recent processed runs from the same project that share the same set of tags as the new run, computes the median total duration across those runs, and checks whether the new run came in meaningfully over that median.
The alert fires when:
new run duration > median * (1 + threshold / 100)
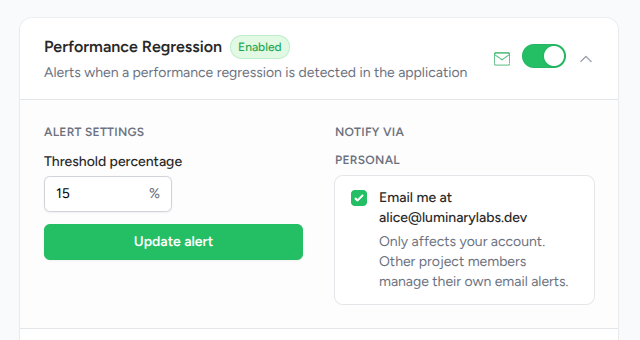
The default threshold is 15%, meaning a new run trips the alert once it runs more than 15% longer than the median of the recent baseline.
The 20-run baseline
The check needs at least 20 processed runs on the same set of tags before it can fire on a project. With fewer than that on the matching tag set, TestNod skips the check and no event is recorded. You don't need to do anything to make the baseline appear other than keep uploading runs. Once 20 runs accumulate on a given tag combination, the alert starts evaluating each subsequent run.
The window is rolling. As newer runs come in and older ones drop off, the median moves with them. A genuine slowdown that becomes the new normal will eventually stop firing, since once it has held for 20 runs it is the baseline.
A worked example
Say your project runs its CI suite on every push to main on Linux, with each run tagged ci:main and os:linux. You're on the default 15% threshold.
The 20 most recent runs with that tag set finished in these durations (in seconds):
118, 120, 121, 122, 122, 123, 124, 124, 125, 125,
126, 126, 127, 128, 128, 130, 131, 132, 134, 140
The median across those 20 values is the average of the 10th and 11th sorted entries, which works out to 125.5 seconds. The 15% threshold puts the trip line at 125.5 * 1.15 = 144.3 seconds.
A new run finishes at 158.2 seconds with the same tag set. Because 158.2 is above 144.3, the alert fires with a recorded increase of 26.06% over the median.
What the alert event shows
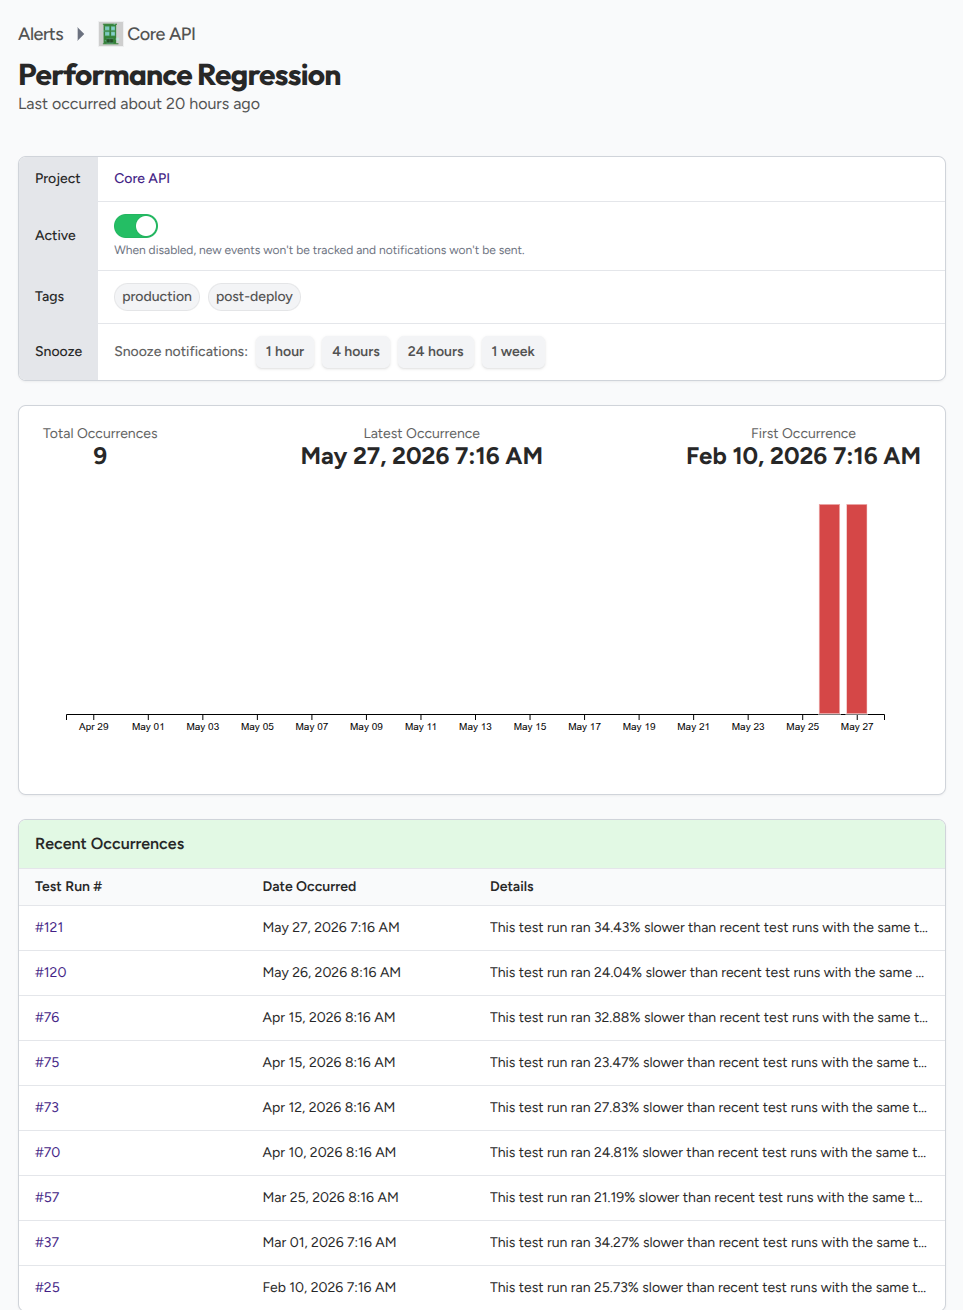
When the alert fires, the event recorded against it shows the new run's total duration, the median it was compared against, the percentage increase over the median, and the tag set used for the comparison. The alert detail page renders these alongside a link back to the triggering run so you can open it and dig into which test cases got slower.
Tuning the regression threshold
The 15% default is conservative enough that day-to-day jitter does not trip it but loose enough that real regressions get caught early. Two cases where you might tune it:
- Too many alerts. If your suite is genuinely jittery, often because it depends on the network or shares CI runners with other workloads, raise the threshold to 25% or 30%.
- Missing real regressions. If your suite is fast and stable enough that smaller slowdowns matter, lower the threshold to 10%. Expect a noisier alert in return.
Project admins set the threshold from the alert configuration page. See Configuring alerts for the walkthrough.
What the alert does not catch
- Slowdowns inside a single test. This alert rolls up to total run duration. Use the What Changed panel's "significantly slower" category for slowdowns in specific cases inside one run.
- Slowdowns on a brand-new tag set. A tag combination that has not appeared 20 times yet has no baseline to compare against. The first 20 same-tag runs are baseline-building.
- Drifts that span different tag sets. Runs tagged
ci:prare only compared against otherci:prruns. Ifci:prandci:mainsuites both got slower at the same time, you'll get separate alerts for each.
Where to start
Once enough history has accumulated, an admin can confirm the alert is enabled on the alert configuration page and adjust the threshold to fit how stable your suite is. From there, TestNod takes over: the next time a run crosses the line, an event lands on the alert detail page and a notification email arrives in your inbox.